Preview only. The full-resolution original is not served on this page.



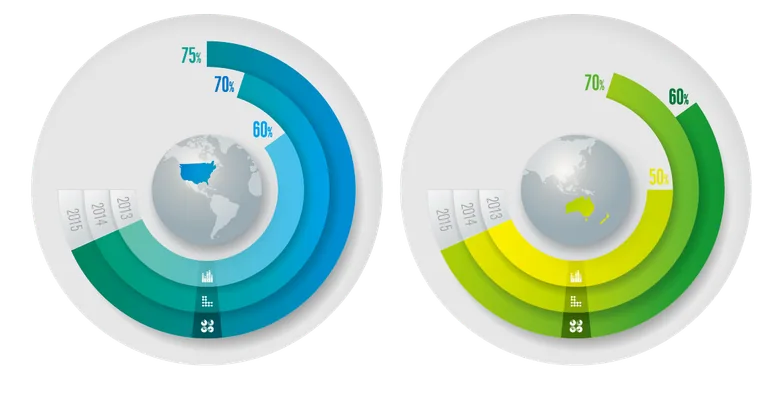
Blue and Green Circular Statistics Infographic
A paired infographic features concentric, open ring charts around globes showing the Americas and Australia. Percentage labels and year markers appear along the colored arcs.
Tags
Transparent PNG
Select format & DownloadResolution1,151 × 598 px
Available file types
PNGOriginal qualityWEBPHigh-quality WebP
KEEP EXPLORING
Related images
Other published images with matching subjects or tags.