Preview only. The full-resolution original is not served on this page.
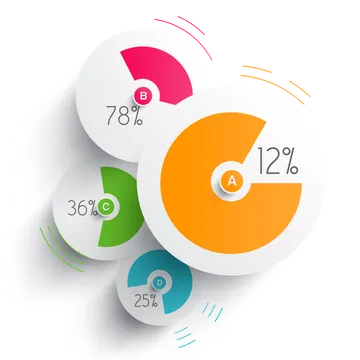


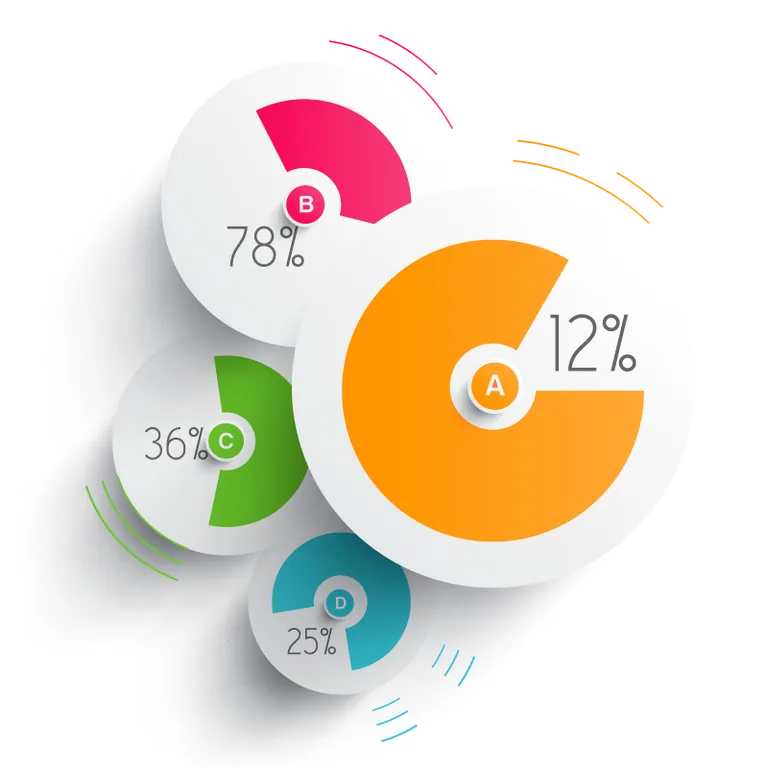
Four Colorful Circular Percentage Charts
A clean, dimensional infographic of four overlapping circular percentage charts. The orange A chart reads 12%, alongside magenta B at 78%, green C at 36%, and teal D at 25%.
Tags
Transparent PNG
Select format & DownloadResolution800 × 800 px
Available file types
PNGOriginal qualityWEBPHigh-quality WebP
KEEP EXPLORING
Related images
Other published images with matching subjects or tags.