Preview only. The full-resolution original is not served on this page.


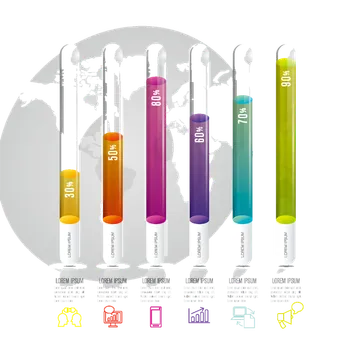
Six-Option Timeline Infographic with Charts and Map
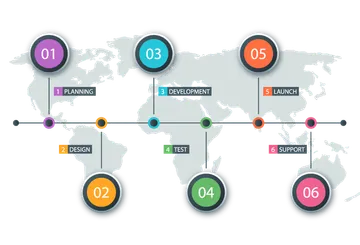
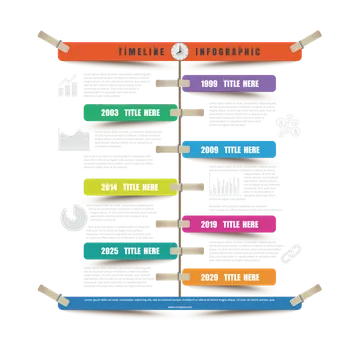
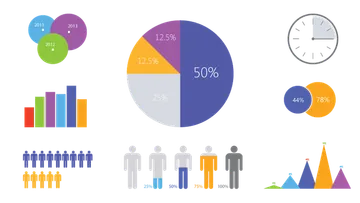
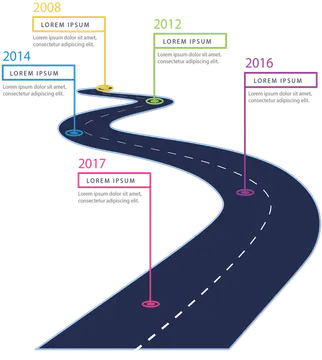
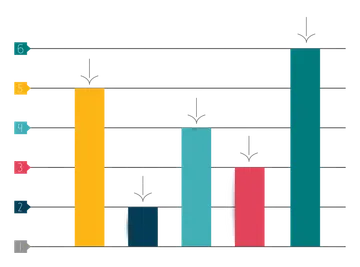
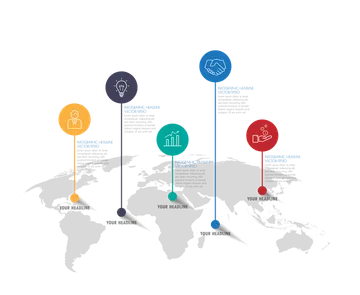
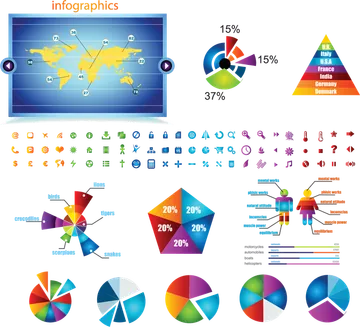
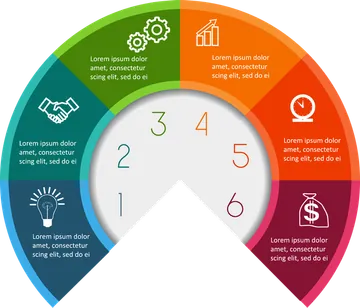
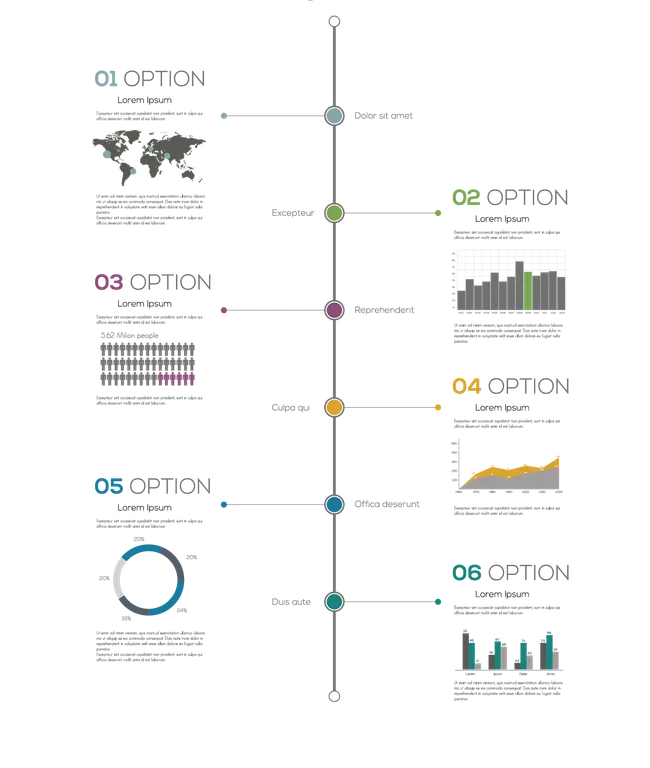
A minimalist infographic presents six options along a central vertical line, with alternating colored markers and short text sections. Small visuals include a world map, bar charts, an area chart, and a donut chart.
Tags
Transparent PNG
Select format & DownloadResolution1,360 × 1,607 px
Available file types
PNGOriginal qualityWEBPHigh-quality WebP
KEEP EXPLORING
Related images
Other published images with matching subjects or tags.