Preview only. The full-resolution original is not served on this page.

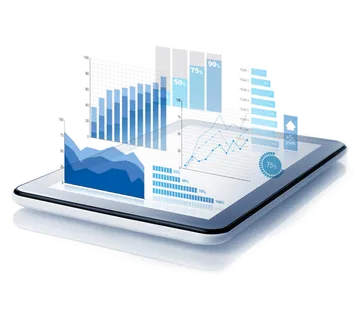
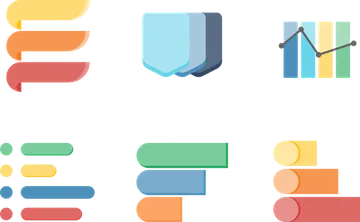
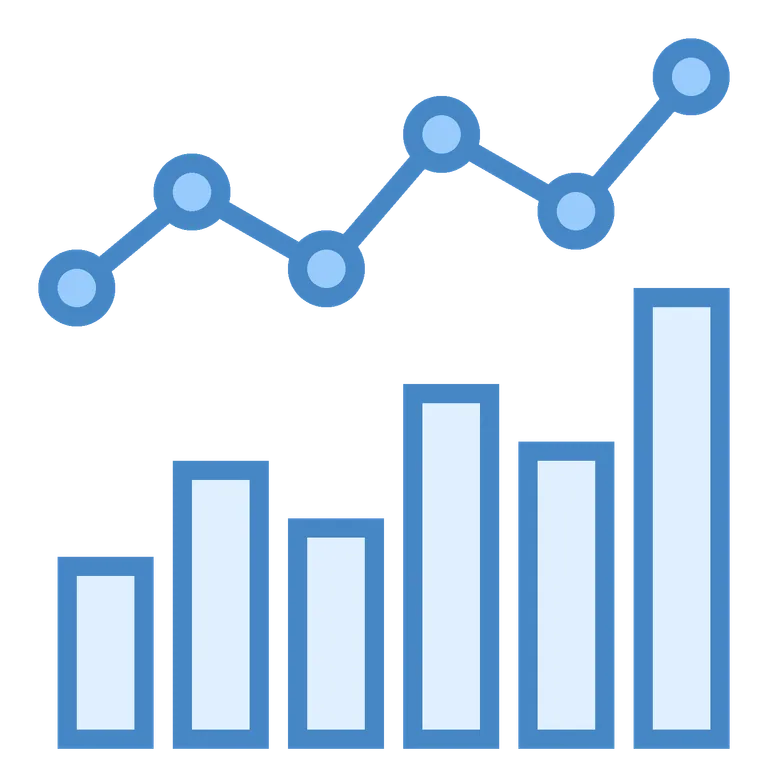
Blue Bar and Line Chart Illustration
A simple blue data visualization pairs six vertical bars of varying heights with a connected line chart above them. The final bar and line point are the highest.
Tags
Transparent PNG
Select format & DownloadResolution1,600 × 1,600 px
Available file types
PNGOriginal qualityWEBPHigh-quality WebP
KEEP EXPLORING
Related images
Other published images with matching subjects or tags.